Covid-19:
Data Visualization Assignment
![]()
Covid-19:
Data Visualization Assignment
Data Visualization Assignment
The following is an assignment that I worked on for Public Policy Lab’s︎︎︎
Design Fellowship.
01 THE BRIEF
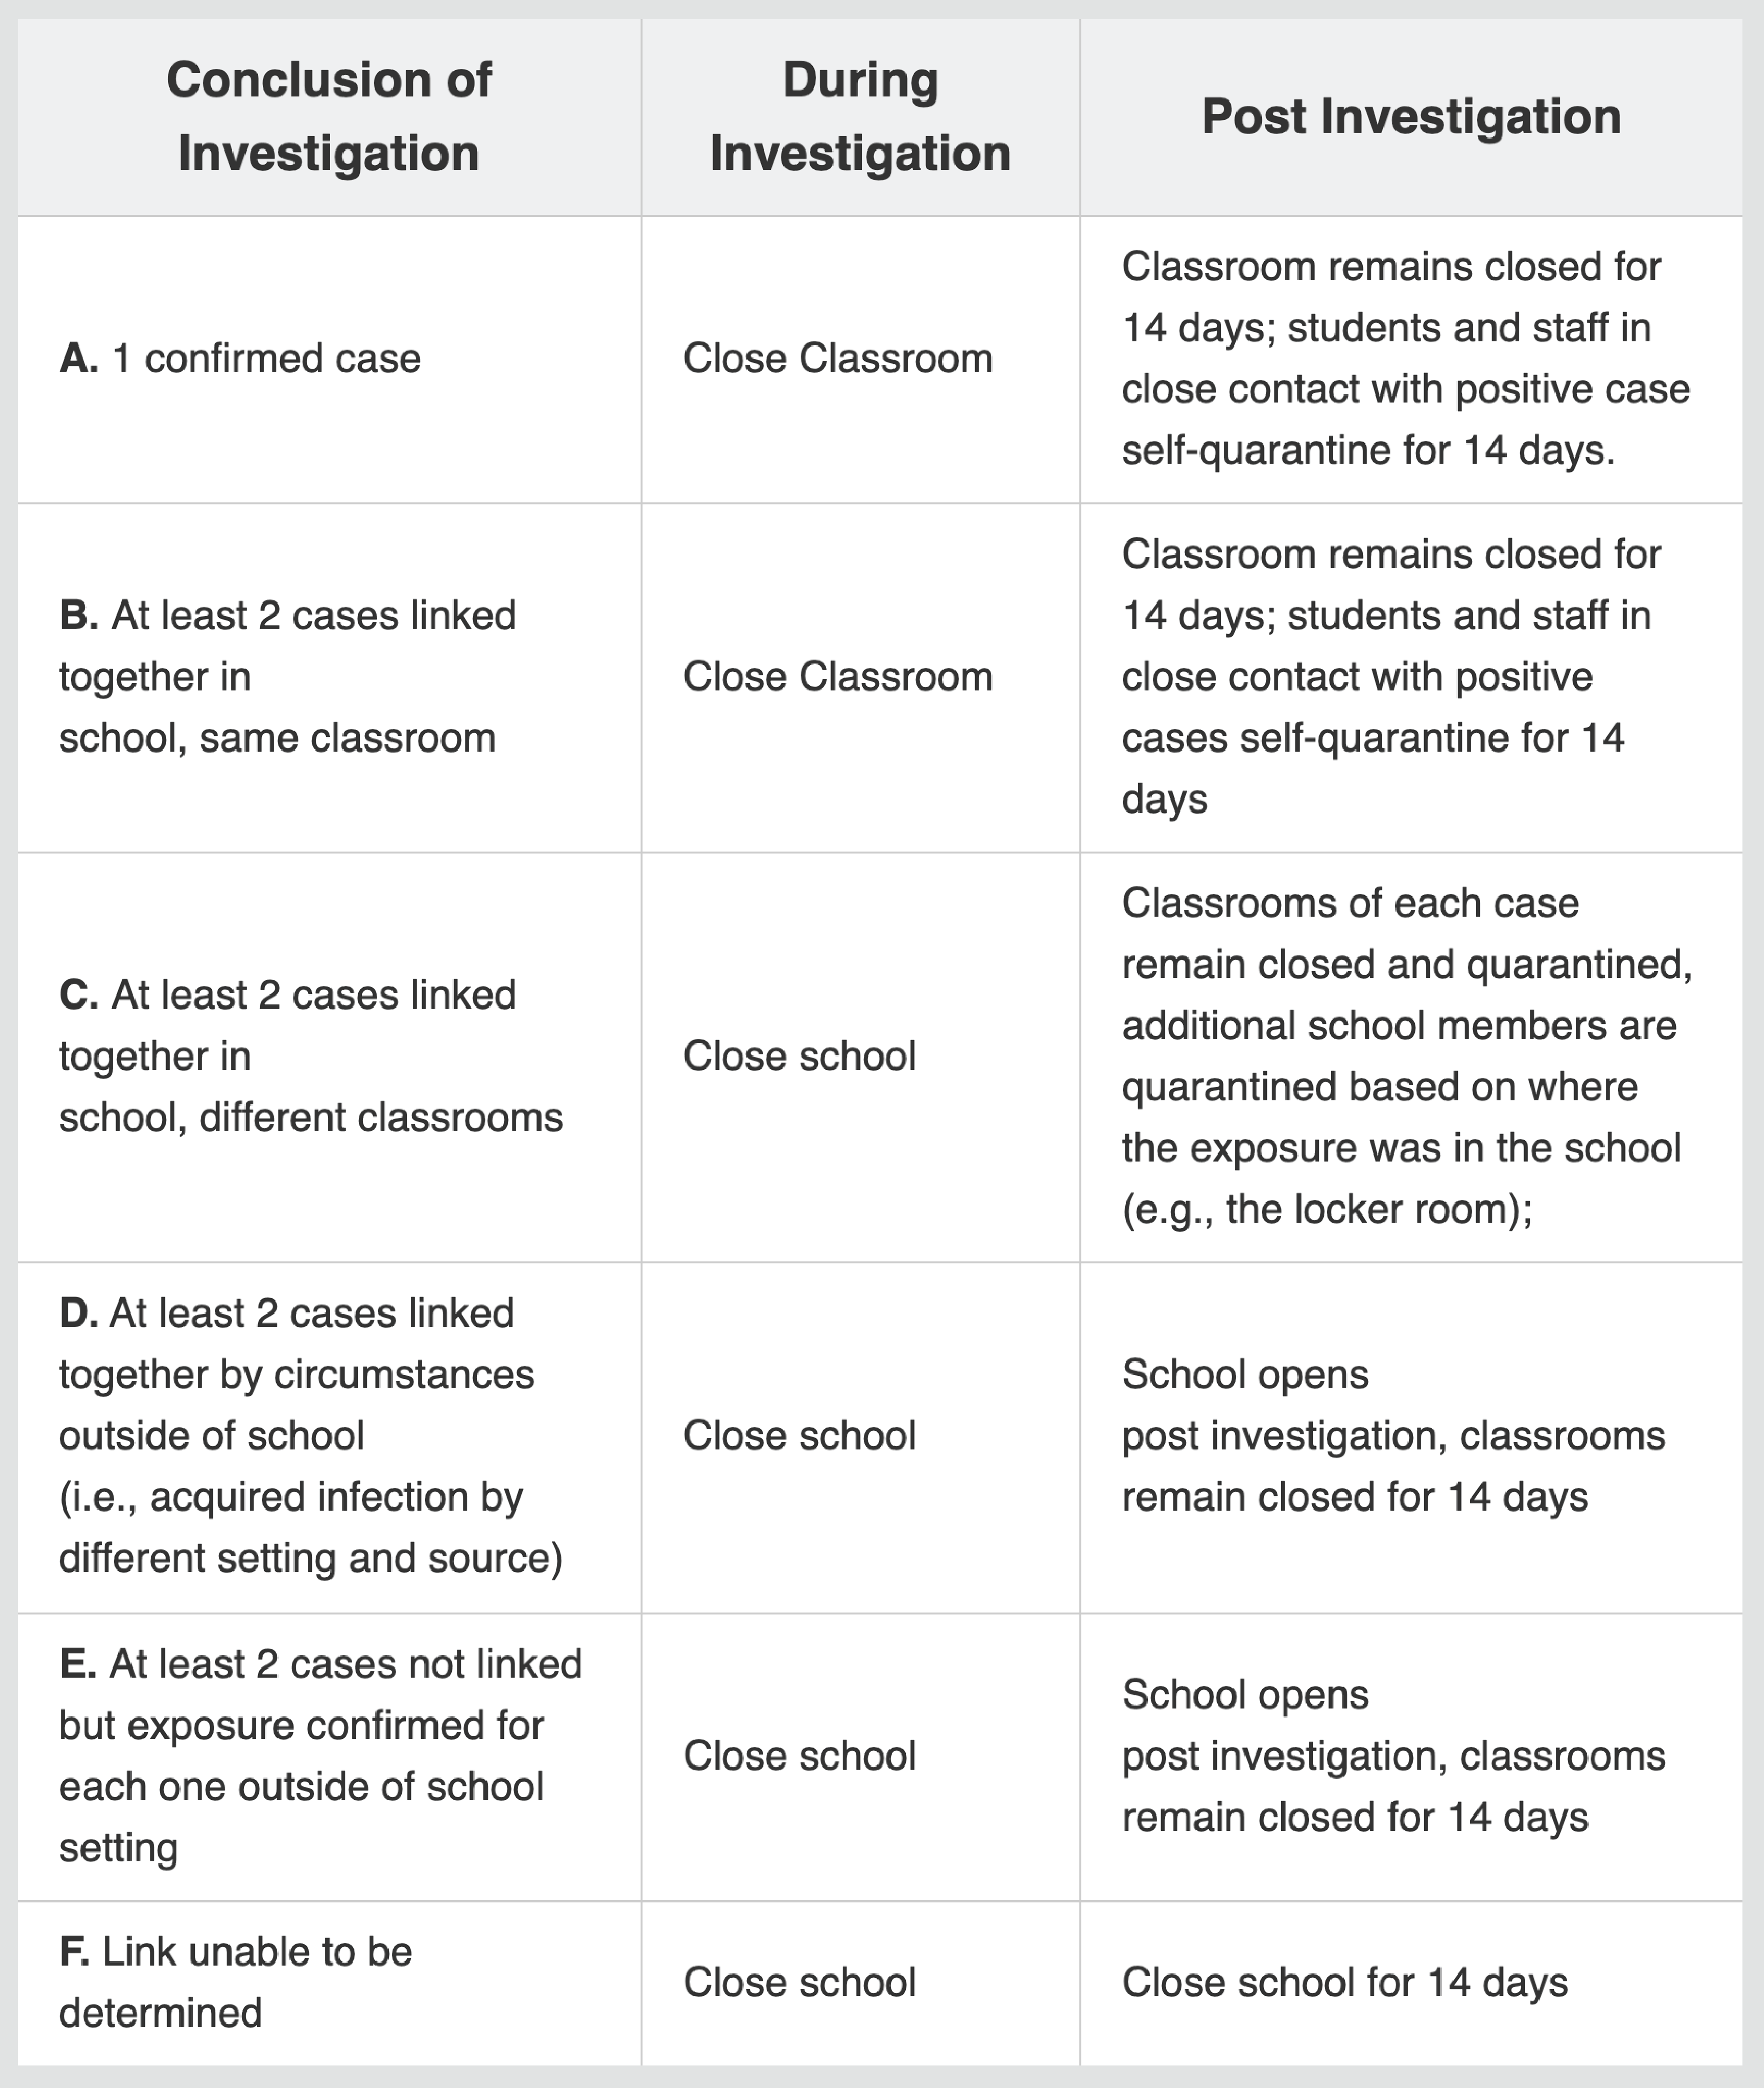
Visually intepret this statement︎︎︎︎︎︎ from the Department of Education about NYC’s plan for handling COVID-19 outbreaks in schools for a specific stakeholder group.
︎︎︎ Pay attention to the table with different scenarios and proposed actions.
︎︎︎ Consider the multiple audiences that this information needs to be conveyed to and the most effective modes of communication to do so.
02 DESIGN PRICIPLES
︎︎︎ Help users understand distinct scenarios.
︎︎︎ Create transparency for all stakeholders.
Design Fellowship.
01 THE BRIEF
Visually intepret this statement︎︎︎︎︎︎ from the Department of Education about NYC’s plan for handling COVID-19 outbreaks in schools for a specific stakeholder group.
︎︎︎ Pay attention to the table with different scenarios and proposed actions.
︎︎︎ Consider the multiple audiences that this information needs to be conveyed to and the most effective modes of communication to do so.
02 DESIGN PRICIPLES
︎︎︎ Help users understand distinct scenarios.
︎︎︎ Create transparency for all stakeholders.
03 FINAL POSTER
The primary stakeholder for this flyer is a school administator whose need is to accurately and effectively communicate information to students and their parents/guardians (secondary stakeholder). In a time when schools can be inundated with information, the flyer is meant to help them understand and communicate the protocol when a COVID-19 infection is suspected at the school.
04 WORKING ASSUMPTIONS
_01
A single/isolated case, regardless of contact tracing results, will result in the closure of only one classroom
_02
A link indicates the chain of transmission.
_03
If no direct link is established between two cases. Then the course of action is the same, regardless of whether the cases are in the same classroom or different classrooms.
_04
Scenario D, E, F would benefit from explicit quarantine instructions but since none were provided in the table, I’ve not included them in the poster.
